How to Make Flow Chart in Canva
Flow charts are mathematical and statistical tools that help to depict a process, system, or computer algorithm in a flow. It adds more charm and attractiveness to your projects and can be used in various fields such as academics, planning, education, management, engineering, and even architecture.
You can easily share your designs with anyone you want. To make a flow chart in canva is not as easy as it sounds so go through the article written below and become a pro in making flow charts in the Canva App.
How to Charts and Graphs Canva
Make Flow Chart in Canva in 9 Easy Steps
Step-1 Open the Canva app: Obviously, the first step is to open the Canva application. If you are working on your mobile phone, then open from menu. If you are working on your desktop, you can directly open the canva app on your web browser.
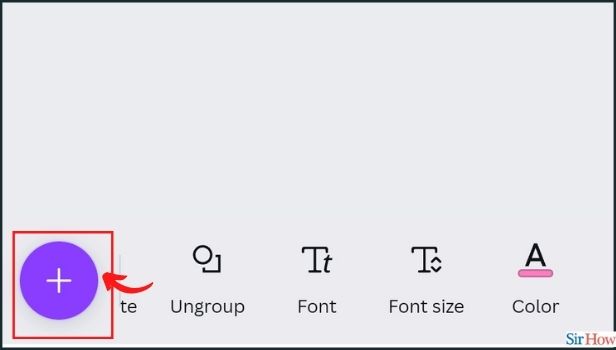
Step-2 Click on the '+' icon: Next step is to click on the '+' icon. It's in the bottom left corner of your editor, which is circular.
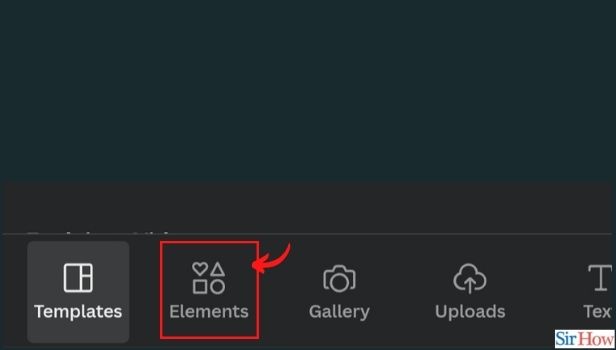
Step-3 Tap on 'Uploads': Click on the 'Uploads' tab from the various tabs given at the bottom of your screen.
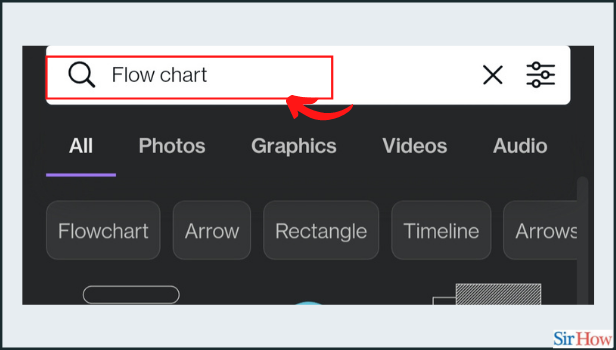
Step-4 Type 'flow chart' in the search bar: Go to the search bar at the top of your screen and write 'flowchart' and click on enter.
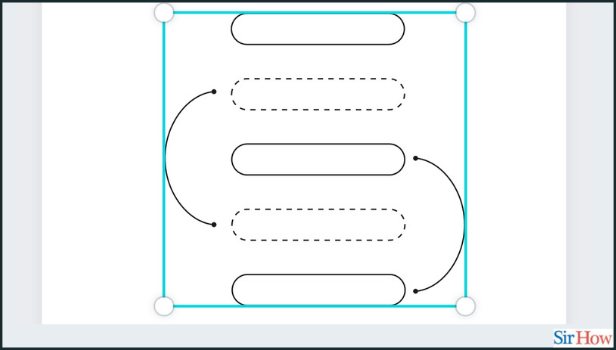
Step-5 Select Your design: After clicking enter in the previous step, you will see a wide collection of already prepared and ready-to-use flow charts from which you will have to select your design. To use the desired design, tap to open it in the editor to start designing.
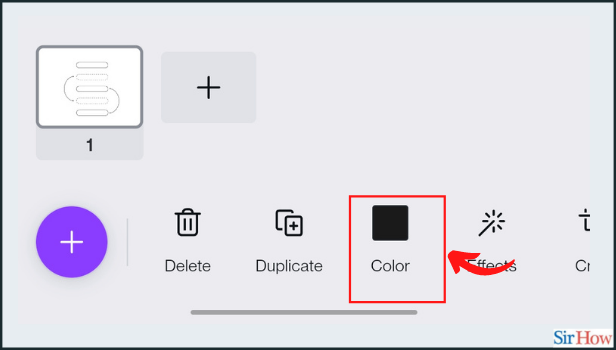
Step-6 Choose the color of the flowchart: Change the color of your flowchart by clicking on the color icon from the toolbar.
Step-7 Add text to your flow chart: To add the text to your design. Click on the icon from the bottom left corner of your editor.

Step-8 Edit your content: Tap on 'Text'. And edit your content.

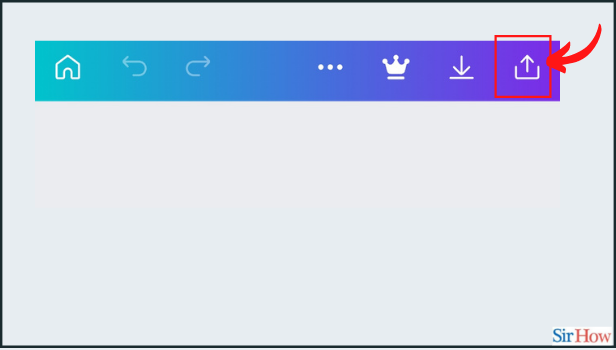
Step-9 Click on Save: The final step is to download your flow chart. Do it by clicking on the download or save button on the top rightmost corner of the screen.
Great Job! Now you have learned how to make flow charts in canva. So, you can also learn how to add comments to a design in Canva.
What is a Flow Chart?
A Flow chart is a mathematical or a statistical tool that helps to depict a process. And, also a system, or computer algorithm in a flow. There are many different kinds of flow charts.
Can We Add More Than One Flow Chart to a Design?
Of course, it is possible to add more than one flow chart to any design, project, presentation, or report. You can add as many flow charts as you want. s there is no restriction on the elements as long as there is space in the editor.
Do We Necessarily Have to change the Color of the Flow Chart?
No, it is not at all necessary to change the color of the flow chart. The chart that you have added to your design. It is completely upon you whether you want to customize the flow chart or use it as it is.