How to Insert Stock Chart in Google Sheets
Google Drive is more than simply a file storage service; it's also a robust web-based office suite. This article will show you how to interact with stock data in Google Sheets, Google's web-based spreadsheet software. If you want to keep track of specific stocks in order to invest in them, downloading applications is never a good idea. Instead, even if you don't have any coding skills, you may easily design your stock tracker on Google Sheets. In this article, we will take a look at How to Insert Stock Chart in Google Sheets.
How to Create a Candlestick Chart using Google Sheets
Insert Stock Chart in Google Sheets: 6 Steps
Step 1 - open google sheet: To insert a stock chart, or as a matter of fact, do anything in google sheets, you need to open the application first. Open the Google Sheets app on your phone or tablet.
- Look for green paper that has a small fold in the top-right corner. It is surrounded by white-defined cells.
- If you can't find it, go to the Google Play Store app to install it on your device.
- Look for the described symbol by typing Google Sheets into the search field.
- Once you've located it, tap install and wait for it to open.

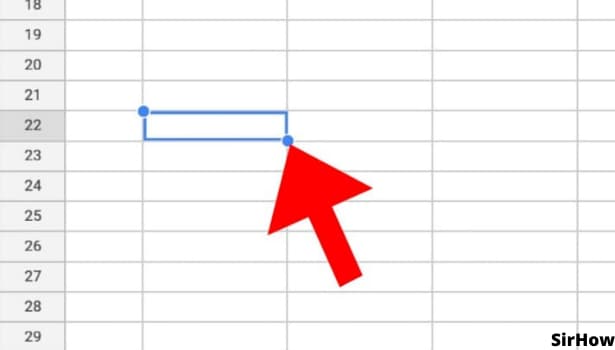
Step 2 - tap on any cell: Select the cell you want to add the stock chart to after you've opened the Google Sheets application and are on the specific spreadsheet. Simply scroll to that cell and left-click on it to pick it. A blue rectangle will appear around that cell, indicating that it has been successfully selected.
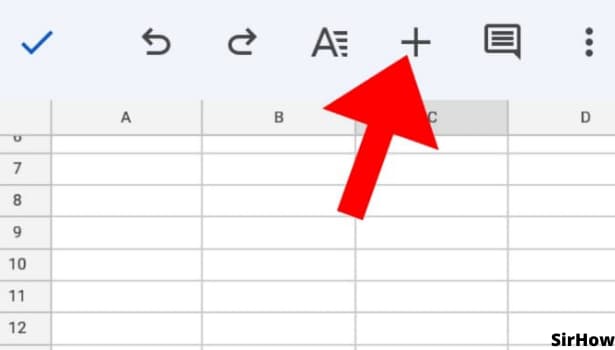
Step 3 - tap on + icon present on the top corner: Simply click the + icon in the upper corner of the interface after selecting the cell to which you wish to add the chart. Depending on the version of Google Sheets you're using, you can also select "Insert."
This will bring up a drop-down menu with a variety of options such as "comment," "Link,", which you can use to add comment to the google sheet cell and so on.
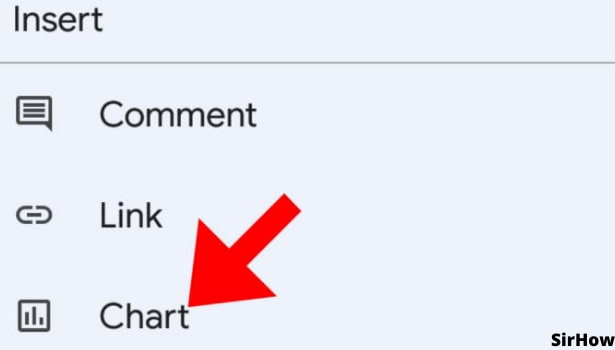
Step 4 - Click on the chart: In the drop-down menu, select the "Chart" option. This will aid in the creation of many types of charts and graphs in the sheets, including line graphs, column charts, pie charts, stacked area charts, and so on.
- Charts make it simple to visualize data and analyze it effectively.
- Instead of going over a lot of numbers, you may just look at the chart and make an informed decision.
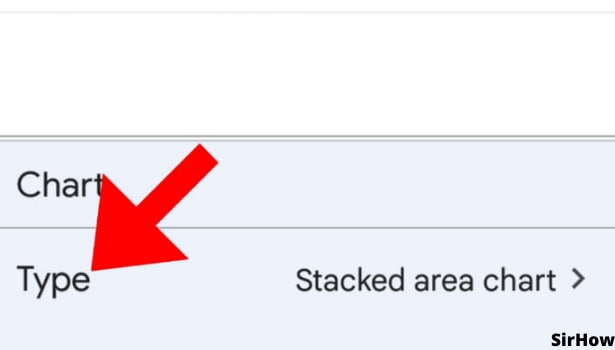
Step 5 - select your chart type: You can now select the type of chart to add in the document. The data set you're working with determines the chart type you employ. For example, if you want to compare values, you can insert a pie chart for relative comparisons and a column chart for precise comparisons.
To compare quantities, you may alternatively use an area chart or a bubble chart. Use a line chart, bar chart, or scatter plot to show trends and patterns in your data. You may use a stock chart to, as the name suggests, better analyze the stocks.
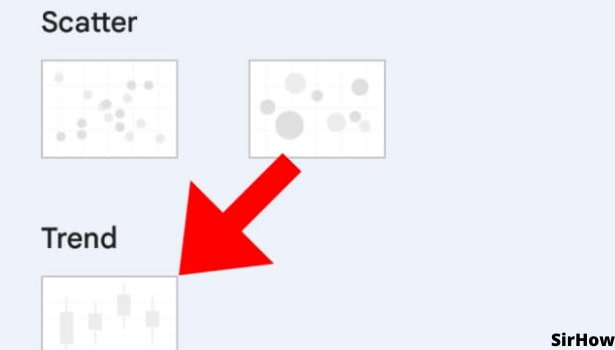
Step 6 - You can insert stock chart: Now, it's just a roller coaster ride from here. Click on the Stock chart under the trends to insert it in your spreadsheet. You can change the appearance of the chart like color of labels, etc using formatting to make it more appealing.
Conclusion
In conclusion, technical traders evaluate market data using a range of stock charts to determine the best entry and exit points for their trades. Above all, you'll have rapid access to the data you need to make good trading decisions if you set up efficient charts in your google sheets document.