How to Create Charts in Canva
A pictorial or statistical representation of any information always helps to give a better understanding of the data. It also gives a better and more attractive impression if you add charts, graphs or tables to your projects, presentations and reports.
Creating charts in Canva is one of the features of the Canva that has helped students as well as business persons a lot in the documentation and project work. You can also Create Folders in Canva to compile and organize your work.
How to Create (improved!) Charts and Graphs Canva
Create Charts in Canva in 13 Steps
Step-1 Open Canva app: You can work on Canva on both your mobile phone and your desktop. Whatever suits you. If you are using your mobile phone, you should have the app installed.

Step-2 Click on the '+' Icon: From the editor, panel click on the plus icon in the bottom left corner of your screen.
Step-3: Click on 'Elements': The next step is to click on the Elements tab from the editor panel from the various tabs available at the bottom of the screen.
Step-4 Search 'Charts': Type 'chart' on the search bar and press Enter.

Step-5 Different charts will appear in front of you: You just have to choose from a wide collection of charts. They will be available to you after clicking on entering in the previous step.
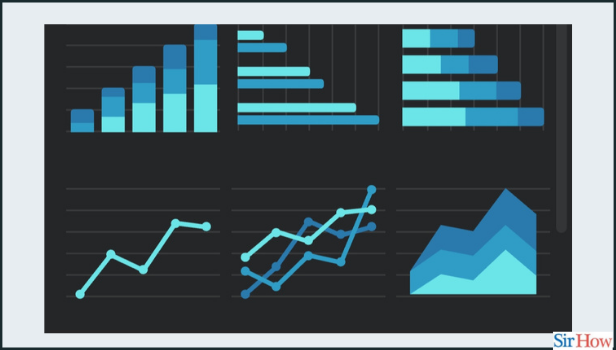
Step-6 Select your design: Click on a chart to add it to your design.
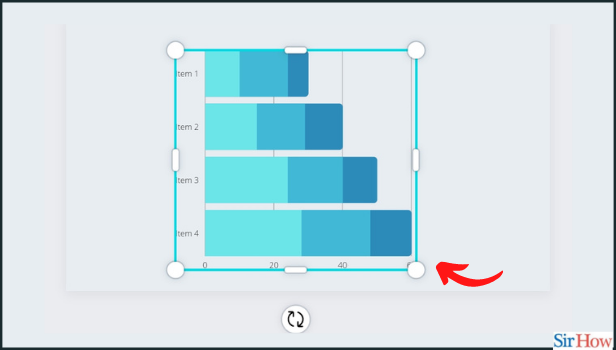
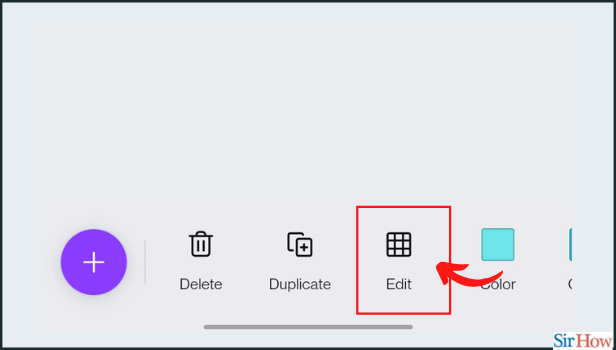
Step-7 Add or edit chart data: Select the chart that you want to edit, and click Edit from the toolbar. The sidebar will show your data fields.
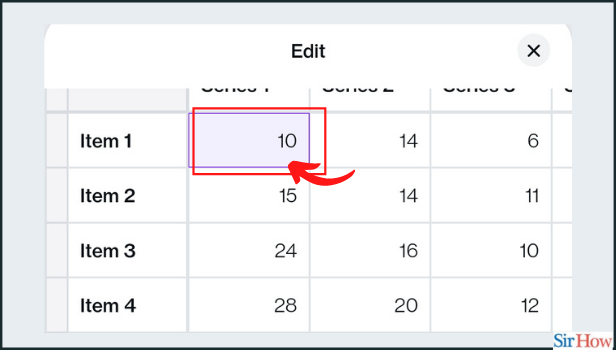
Step-8 Edit the data as per your requirement: Click the fields in the table to input your data. Be very careful while adding the data to save your time later.
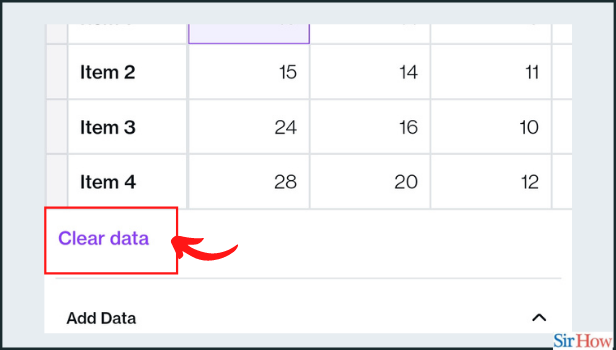
Step-9 Clear and Edit data: If you want to add fresh data, click the clear data and add your new data.
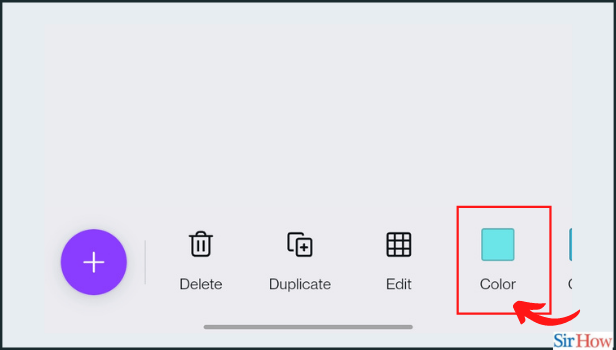
Step-10 Edit chart colors: To change the Chart color, click a color tile on the toolbar above the editor to pick a new color
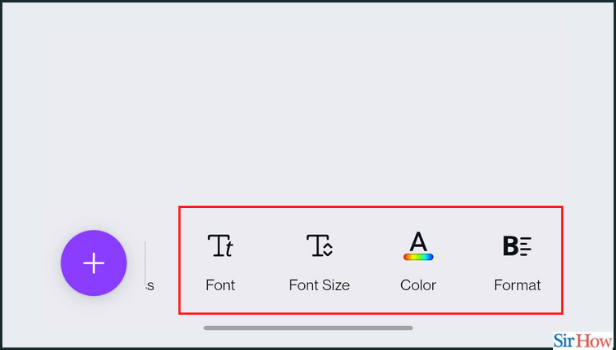
Step-11 Change Chart style: Click Edit from the toolbar, and change the font style, size etc.
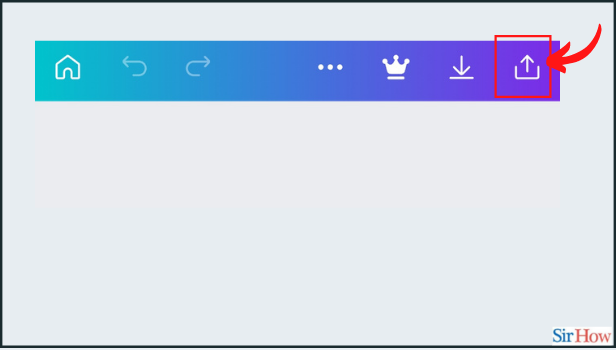
Step-12 Download and Save: After the chart is ready, click on the download button. It is available at the top right corner of your screen.
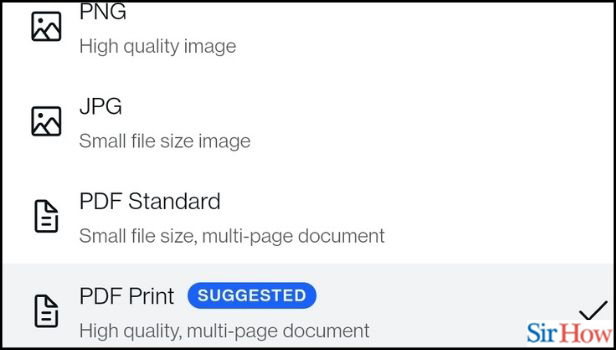
Step-13 Choose the format as PNG, JPG OR PDF: It completely depends on you in which format you want to download your chart.
Can We Create Multiple Charts in Canva?
You can easily create multiple charts in Canva in the same13 steps as mentioned in the article above. Also, you can customize your chart in any way you want.
If you are adding text to the chart, you can also Create Text Shadow in Canva.
What Has to be The Size of The Chart?
As you know that the size of the chart completely depends on the date. Or the information that you tend to add to your chart.
The more the data, the larger the size of your chart will be. The purpose of a chart is to compile big data attractively.
Can We Hide Our Phone Number On Telegram?
Canva has a very user-friendly policy as you already know. This is because it protects the privacy of its users through its policy. It allows the users to hide their phone numbers if they wish to do so.