- Google Sheets
- email google sheets file
- insert comment google sheets
- insert sheet google sheets
- make drawing google sheets
- view google sheets file
- link different files
- add text after formula
- install google sheets pc
- install autocrat google sheets
- make pivot table
- install google sheets laptop
- install google sheets
- make google sheets
- make google sheet blank
- fill color google sheets
- change font size
- change font style
- download file in ms excel
- add slicer in google sheet
- save file in google sheets
- change font style gs
- see details of google sheets file
- find & replace text gs
- sort google sheets by column
- add dollar sign g sheets
- column color gs chart
- sort google sheet by color
- sort google sheet by date
- add percentage formula in google sheets
- unhide google sheet column
- change case in google sheet
- import csv file google s
- download file ms excels format
- checkbox color google sheets
- rotate text google sheets
- fill color in cell
- create border google sheet
- insert chart in google sheets
- insert link
- insert line graph gs
- insert column chart in gs
- download gs html formats
- insert stock chart in google sheets
- make google sheet dark mode
- add sheet
- make duplicate file gs
- insert formula entire column
- set themegoogle sheets
- sort filter data gs
- import data gs
- delete cells column
- make group gs
- undo on google sheets
- print google sheets
- gs cells fit text
- create filter google sheets
- freeze google sheet row
- multiplication formula gs
- add subtraction formula in google sheets
- add labels google sheets
- use add ons in google sheets
- check gs edit history
- add date formula in gs
- change google sheets date format
- change google sheets permissions
- google sheet by number
- make gs cells bigger
- change border color gs
- use google sheets offline
- track google sheets changes
- google sheets for budgeting
- google sheets read only
- share google sheets link
- create a new google sheet
- average formula in google sheets
- cell color in google sheets
- change font size gs
- change chart color in google sheets
- add formulas and functions
- add sum google sheets
- move files in google sheets
- how to use google sheets budget template
- google sheets available offline
- pie chart in google sheets
- google sheets on mobile
- image link in google sheets
- make google sheet template
- use google sheets
- edit format google sheets
- note in google sheets
- send google sheets as pdf
- currency format googles sheets
- make google sheets graph
- tick box in google sheets
- share google sheets whatsapp
- color in google sheets
- install google sheets android
- share google sheets with everyone
- share google sheet with everyone
- save google sheets as pdf
- make google sheets calendar
- set the alignment of text
- add rows columns g sheets
- wrap text in google sheets
- view comments in google sheets
- share sheets with others
- comments in google sheets
- merge cells google sheets
- make google attendance sheets
- make google attendance sheet
- insert image over cell
- insert image in google sheets
- copy of google sheets
- share google sheets
- rename a google sheet
- print file google sheets
- delete row google sheets
How to Add Slicer in Google Sheet
The users of the Google Sheets app have the option to Slice their data as they can add Slicer in Google sheets.
Slicing means removing unnecessary or unimportant data from your spreadsheet. We basically use a Slicer in things such as charts and other graphical representations. Similarly, you can also delete cells, rows, and columns in Google sheets. Let's learn how to do this with the ho of this article given below.
How to Use Slicers to Filter Data in a Google Sheet
Add Slicer in Google Sheets in 9 Steps
Step-1 Open Google Sheets: The first step in the process of adding a slicer in Google sheets is opening your google sheet.
So, first, open the Google sheet in which you want to add a slicer to your device. You can open the spreadsheet on any device as there are no restrictions on that.
- You can either open the file on your web browser with the link directly in the Google sheets application.
- Or, in the mobile app also.

Step-2 Select Your Data: Then you have to select all the dates in your spreadsheet that you want to want to represent in the form of a chart.
After selecting your data, it will get highlighted in light blue color as shown in the picture below.
Step-3 Click On The 'Insert' Menu: Go to top of your spreadsheet now and look at the topmost tab bar.
In this tab bar lies the 'Insert' menu tab. You have to click on this tab now.
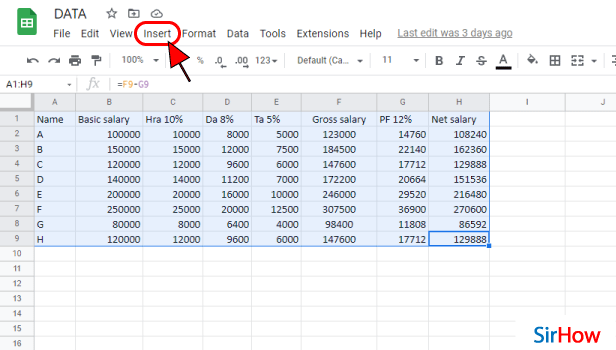
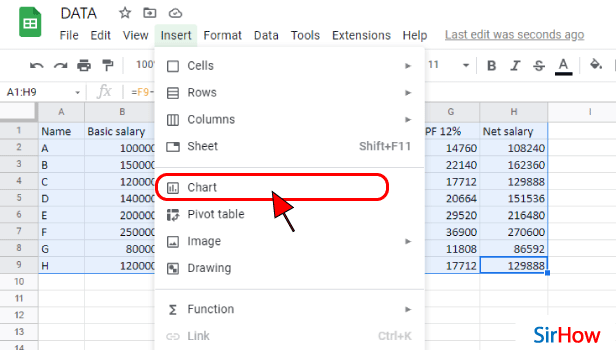
Step-4 Tap On 'Chart': From the list, you have to select the option that says 'Chart'. It will help you to add charts to your spreadsheet.
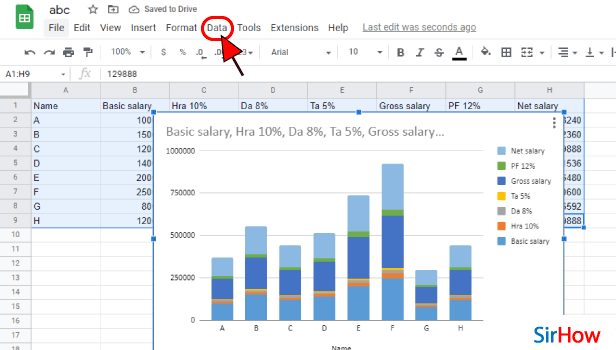
Step-5 Click On The 'Data' Menu: Doing the previous step will add a chart to your spreadsheet. The chart or figure is the entire of your choice.
After the chart is added to your sheet you have again to go to the tab bar on top. Then, simply click on the 'Data' tab.
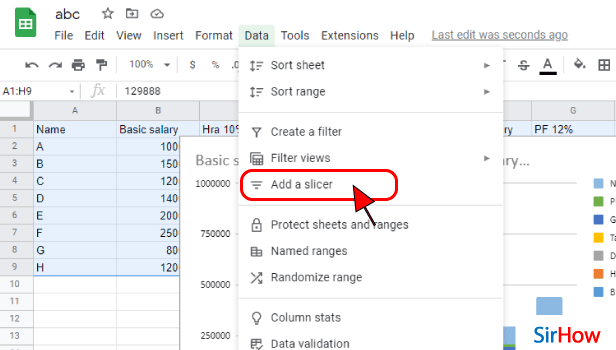
Step-6 Click On 'Add a Slicer': The fifth option in the list of the 'Data' tab is the option that says 'Add a slicer'. You are now supposed to click on this option to move forward and add a slicer to your sheet.
Step-7 Select Your Data to Slice: A Slicer panel will appear on the left side of your page as shown in the picture below. You can now customize your slicing process.
Just select the proportion of the data that you want to Slice.
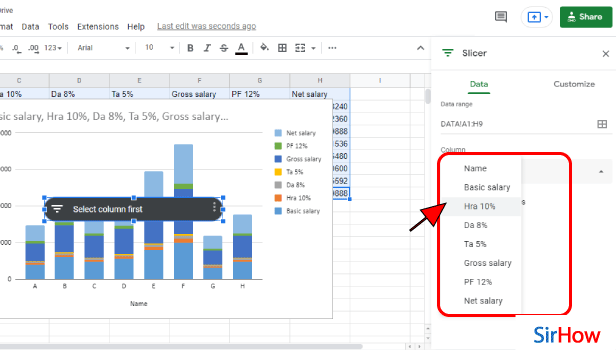
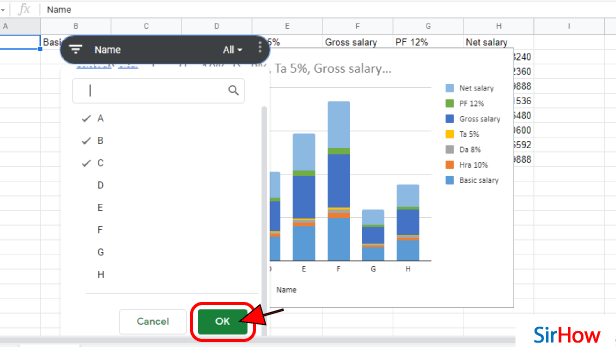
Step-8 Select or Deselect Data You Want to See: Here, you have to do the below-mentioned two things:
- First, select or deselect the data that you want to see or do not want to see.
- Then, click on the 'OK' button.
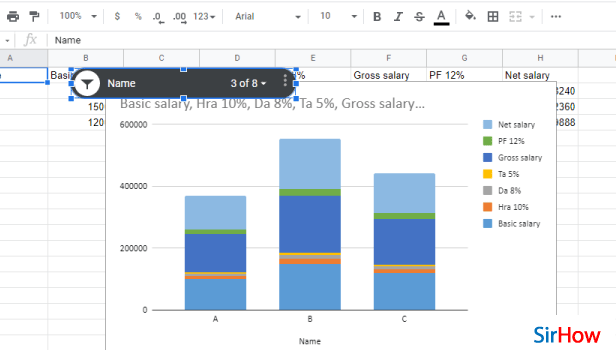
Step-9 Slicer is Added: As you can see the slicer had already been added to your data now.
You can again perform these steps if you want to further slice data in your spreadsheet or your graphical representations like charts.
FAQ
What Is The Work Of The Google slicer?
The main purpose of a Slicer, in this case, the Google slicer is to provide general-purpose sharding service to the application or software.
- The Google slicer handles the task of monitoring signals such as load hotspots and server health.
- It also dynamically shards work over a set of servers.
- The main aim of Google slicer is to maintain high availability.
- Also, it reduces load imbalance while minimizing churn from the work.
What Is The Difference Between A Slicer and A Filter?
A slicer and a filter are two completely different things. But, sometimes it can be pretty confusing to understand their functions.
Here, we have talked about the difference between the two:
- Slicers are basically visualizations or graphical representations on a canvas. For instance, Power BI canvas allows users to refine the data for themselves easily.
- On the other hand, Filters are for developers. Developers use them to refine specific visuals, entire pages, or whole workbooks. They do it before sharing the dashboard(s) with the end users.
Can I Connect Slicer to Multiple Pivot Tables in Google Sheets?
To connect a slicer to multiple pivot tables in your Google sheets at the same time, you have to follow the given steps:
- Go to your spreadsheet.
- Enter your data.
- Then, create the chart of your choice for the data. You can insert pie charts in Google sheets or any other chart of your choice.
- Now, click any of the multiple charts in which you want to add Slicer.
- Go to the 'Data' menu and then, select the 'Add a Slicer' option.
- You will be able to see a new slicer button created on top of the worksheet.
Related Article
- How to Share Google Sheets on WhatsApp
- How to Change Color in Google Sheets App
- How to Install Google Sheets on Android
- How to Share a Google Sheet with Everyone
- How to Share a Google Sheet with Everyone
- How to Save Google Sheets as PDF
- How to Make a Calendar in Google Sheets
- How to Set The Alignment of Text in Google Sheets
- How to Add Rows and Columns in Google Sheets
- How to Wrap Text in Google Sheets
- More Articles...
