How to Add Labels to Charts in Google Sheets
Are you using charts and graphs in your Google Sheets? Would you like to add labels to charts in Google Sheets? Well, then you're at a perfect place. You might have made a Google Sheets graph but forgotten to change labels. As a result, you would be seeing default labels. However, they can be changed as per your wish even after adding the chart. So, let's get going and change those labels.
How to add data labels to a chart in Google Docs or Sheets
Add Labels to Charts in Google Sheets: 7 Steps
Step-1 Open Google Sheets App: Open Google Sheets application on your device. Look for green paper with a tiny fold on the top-right corner. It has white outlined cells over it.
- If you do not find it, then go to the play store application.
- Type in Google Sheets in the search bar and look for the described icon.
- Once you find it, click on install and let it open.

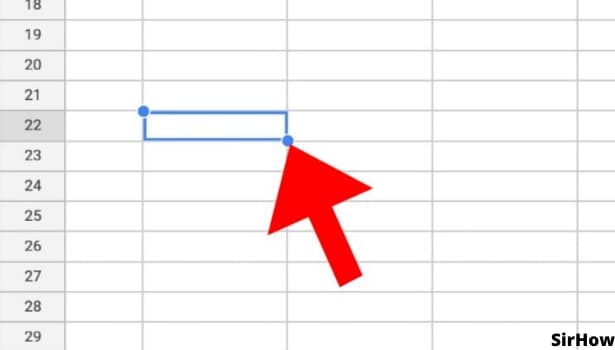
Step-2 Tap on Any Cell: Once your Google Sheets application is open, just select the Google Sheets file that you want to work on. See to it that the file you open has a chart added to it. Click on any cell to go ahead with the steps.
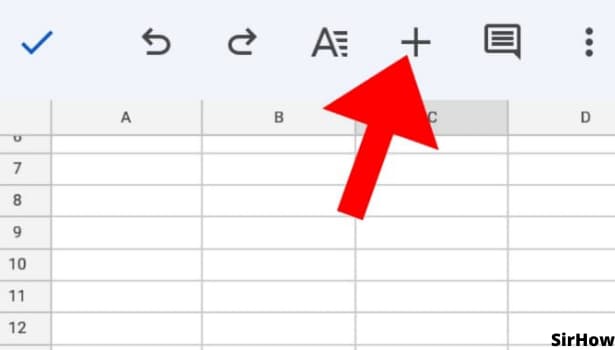
Step-3 Click on the '+' Icon: On clicking any cell, a formatting toolbar appears at the top of the screen. In that toolbar, you need to click on the plus sign icon exactly at the center.
Step-4 Click on Chart: To add labels to charts in Google Sheets, select the option of the chart. After clicking on the + sign, a drop-down menu appears.
- That is an insert menu from where different items can be added to Google Sheets.
- There is an option of charts just below the link and above the image option.
- Select that option to go further.
.jpg)
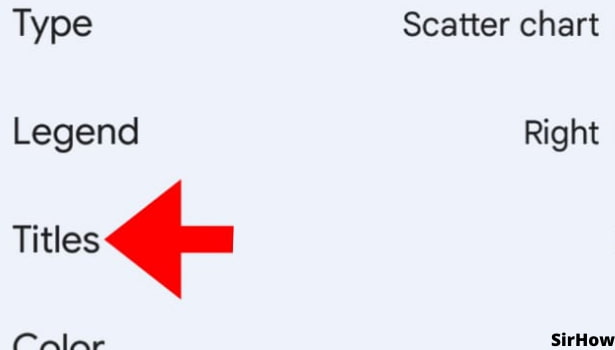
Step-5 Click on Titles: By clicking on charts, a settings table of the inserted chart opens up. It has all the details regarding the chart that you have added.
- It specifies the type, legend, titles, and color of your chart.
- To add labels to charts in Google Sheets, you have to select the option of titles.
- It will take you to another editing table.
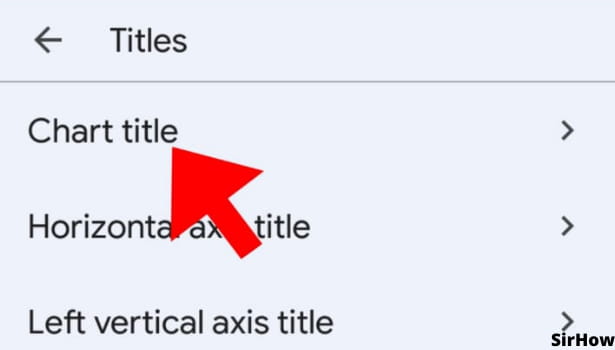
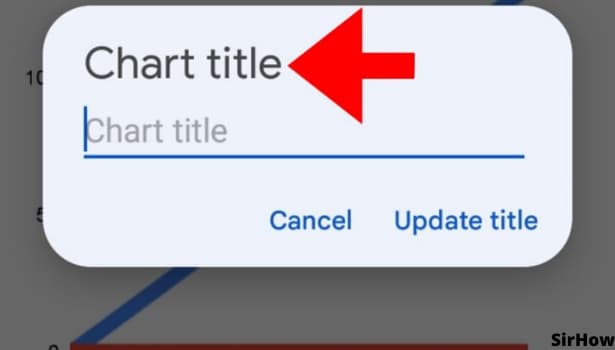
Step-6 Click on Chart Title: From here, you can add and change the chart title. Click on the option of chart title and you will be able to add the label you desire. You can even change the labels of the X-axis and the Y-axis accordingly.
Step-7 Add Labels to Charts in Google Sheets: You can type in the labels you want in the dialogue box of the chart title. Title and label mean one and the same.
- You must go back and forth in these settings from the arrows available in these boxes.
- To go ahead, there is an arrow at the right end of the option that looks like a greater than sign >.
- To go back in the settings, you will see a back arrow icon at the top left corner.
- Navigate from here or else you will be taken completely back to your sheet.
- Also, do not forget to click on 'Update Title' after typing in the label that you want.
Specifying labels helps the viewers to understand the purpose and meaning of the chart. It becomes easy to analyze and assess what the chart represents by its appropriate labels. To clarify, Google Sheets will have its default labels based on the format of your sheet but adding yours give a personalized touch to it. Just like changing colors in Google Sheets to add the desired meaning, changing labels also helps give an experienced touch to sheets.